Casino Visitation Trends and Strategic Windows for Heads-Up Play at Regional Sites
Vera Becker · Jul 22, 2026
Casino Visitation Trends and Strategic Windows for Heads-Up Play at Regional Sites
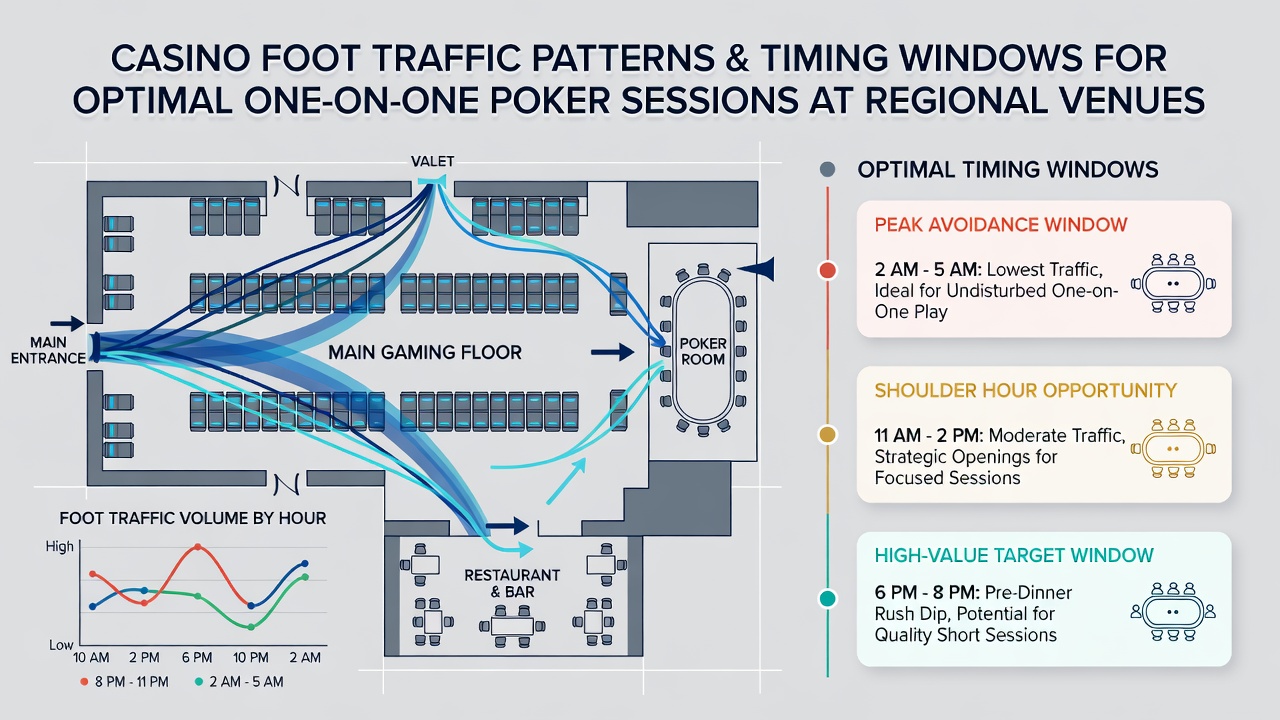
Regional casinos display distinct visitation rhythms that shape opportunities for one-on-one poker sessions, with data from multiple jurisdictions revealing consistent daily and weekly cycles. Observers note that foot traffic typically builds from mid-morning onward, driven by shift workers and retirees who arrive before lunch, while evening surges occur after 6 p.m. as commuters finish their days and local residents seek entertainment. These patterns hold across U.S. state-regulated properties and similar venues in other countries, where entry logs and table occupancy reports track the same trends.
Daily Movement Cycles in Regional Properties
Research from the American Gaming Association indicates that weekday mornings between 10 a.m. and 2 p.m. produce moderate foot traffic at many Midwestern and Southern U.S. casinos, creating intervals when poker rooms experience lower table demand yet maintain staff coverage. In contrast, Friday and Saturday evenings generate the highest overall visitor counts, with regional properties reporting occupancy rates that can exceed daytime levels by 40 percent or more according to aggregated state gaming reports. Those who monitor these cycles find that one-on-one tables often become available during shoulder periods such as early afternoon or late night when general casino crowds thin but poker enthusiasts remain active.
Weekly and Seasonal Variations Across Venues
Weekly patterns show clear differentiation, with Tuesday through Thursday emerging as lower-traffic stretches in many locations while weekends concentrate activity around entertainment events and promotions. Seasonal shifts add another layer, particularly in July 2026 when summer tourism and regional festivals coincide with increased arrivals at properties near vacation destinations. Data from Australian state regulators, for instance, shows comparable spikes during holiday periods that affect table availability in poker areas. Observers tracking these changes note that regional venues near urban centers experience steadier baseline traffic than rural sites, where weekend spikes prove more pronounced due to drive-in visitors.
Timing Considerations for One-on-One Sessions
Optimal windows for heads-up play align with periods when poker room traffic remains sufficient to populate tables without overwhelming demand for side games. Studies of casino operations reveal that sessions starting between 11 a.m. and 3 p.m. on weekdays frequently encounter fewer players competing for the same limited heads-up seats, whereas post-dinner hours bring higher volumes of recreational participants. Venues in Canada and parts of Europe demonstrate parallel rhythms, where regulatory filings document afternoon lulls followed by evening buildups. Players who align their visits with these documented intervals encounter steadier access to one-on-one matchups while avoiding the peak congestion that limits table selection.
Regional Differences and External Influences
Geographic factors influence these patterns significantly, as properties in high-tourism zones report different daily peaks than those serving primarily local markets. A report compiled by the Nevada Gaming Control Board highlights how proximity to major highways or event centers alters arrival times, shifting optimal poker windows by several hours compared with more isolated regional sites. In July 2026, scheduled circuit events at certain venues further modify traffic flows, drawing additional participants during specific multi-day stretches. Those analyzing venue-specific data find that integrating local event calendars with general visitation statistics improves prediction accuracy for table availability.
Practical Application of Traffic Data
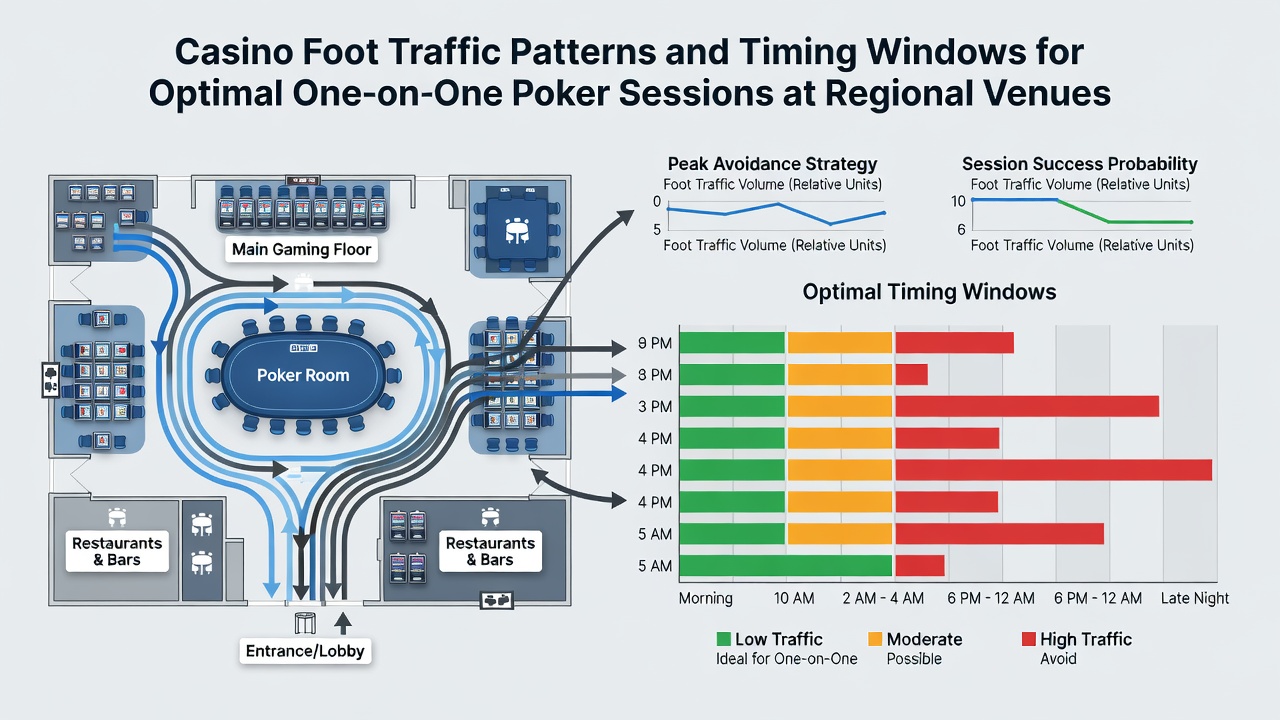
Operators and analysts increasingly cross-reference foot traffic metrics with poker room logs to identify recurring availability windows. Figures from multiple regulatory bodies show that combining weekday afternoon data with post-holiday recovery periods yields the most reliable intervals for sustained one-on-one activity. Venues that publish occupancy summaries allow external observers to refine timing strategies without relying on anecdotal reports alone. This evidence-based approach connects broader casino movement patterns directly to poker-specific outcomes across different regional markets.
Conclusion
Casino foot traffic follows measurable cycles shaped by time of day, day of week, and seasonal events, with July 2026 providing one illustration of how external factors overlay standard patterns. Regional venues exhibit these rhythms consistently enough for data-driven planning, enabling identification of windows that support one-on-one poker sessions amid varying crowd levels. The integration of regulatory statistics and operational reports continues to refine understanding of these dynamics across jurisdictions.